Hardware Monitor Screenshots
A screenshot of all views monitoring CPU and network usage:
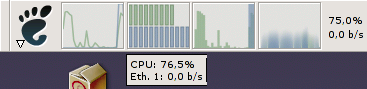
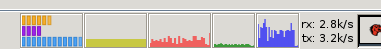
To the left the curve viewer (all-round), then the bar viewer (best for disk/memory usage actually), then the cool flame viewer (for l33tn3z effect) and finally the text viewer. The five instances were made by adding the applet four times to the panel - of course, in the normal case you would only have one or two instances running. No matter what, only one process is actually running, though, so it will not eat too many resources.
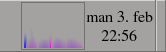
The flame effect is really best seen real-time - however, here's how it looks like when you let it monitor an Ethernet card (pink) and the CPU usage (blue). Notice the small sparks.
 |
 |
To the right I'm compiling a program.
Adding a new monitor in another setup:
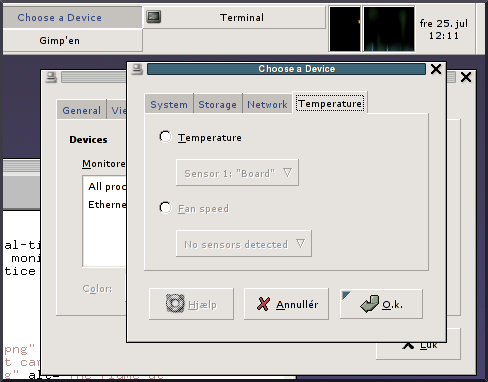
The devices preferences:
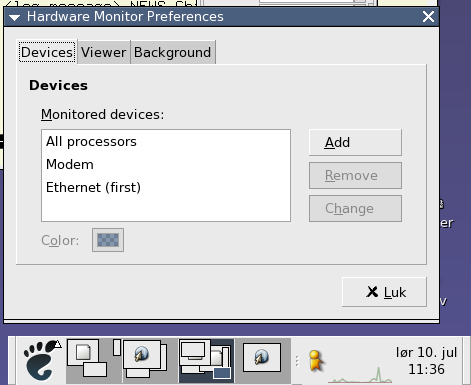
In general, the applet tries to figure out the best setup itself so that you don't have to waste time configuring everything. This makes it possible to reduce the UI clutter, and it is also more challenging and fun to program.
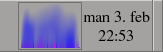
A nice screenshot from Ian Langworth:
Starting at left: sensors (CPU, motherboard, CPU fan), disk, CPU usage, net receiving, net transmitting. The rx/tx is from Gnome Network Monitor.
If you have a more interesting or exciting setup, please send a screenshot to me so that it may end up here in the hall of fame.
Back to main page.